|
|
| By Ethan Winer (EW) of RealTraps and Nyal Mellor (NM) of Acoustic Frontiers
Also see THIS newer article that expands on the information presented below. The importance of room acoustics is often overlooked, even by those who consider themselves serious listeners. People who obsess over vanishingly small amounts of distortion or frequency response errors in their gear accept response deviations of 30 dB or more added by their room. Often they have no idea how bad their room really is! This graph shows the low frequency response measured in a typical small living room:
But a skewed frequency response is only one of the problems caused by poor room acoustics. Rooms also resonate and ring, sustaining some frequencies longer than others. If you clap your hands in an empty bedroom you can hear the pitched "boing" sound caused by reflections bouncing repeatedly between opposing surfaces. The pitch of the boing is related to the distance between the boundaries. The same thing happens at bass frequencies, but hand claps don't have enough low frequency content to excite the resonances. The resonances are still there, and they damage bass clarity, but you need an appropriate test signal to measure them. Even if the steady state room response were perfectly flat, if 1 KHz sustains for half a second longer compared to other frequencies, the perceived volume at that frequency will be higher due to the additional energy over time. So one important metric for room measurement is decay time versus frequency. The goal is for decay times to be more or less uniform over as wide a range as possible. In larger rooms, excess reverb and ambience cloud detail, and in smaller rooms "early" reflections - those arriving at your ears within about 20 milliseconds of the direct sound - have a similar effect. Besides obscuring detail, early reflections also create a particular type of response error called comb filtering. Indeed, all acoustic problems are caused by reflections off the walls, floor, and ceiling. I separate room acoustics - both measurements and treatment - into two frequency ranges: bass below about 300 or 400 Hz and mid/high frequencies above 400 Hz. For low frequencies it's important to see as much detail as possible. This means measuring and displaying the response at high resolution in order to see the true extent of peaks and nulls. This next graph shows the exact same measurement at two different resolutions:
At mid and high frequencies it's more appropriate to use averaging. Small changes in microphone placement have a huge effect on the measured response. A graph of the high frequency response that is not averaged is riddled with so many peaks and nulls it's difficult to see the forest for the trees, so to speak. Why we measure Many people believe that room measuring is needed to know how to approach treating a room, to determine the number and placement of bass traps, mid/high frequency absorbers, and diffusors. But in most cases you can treat a room effectively without measuring at all. The basic goal is to put bass traps in the room corners, mid/high frequency absorbers at the side-wall and ceiling reflection points, and optionally absorbers and/or diffusors on the rear wall behind the listener. Treating the rear wall is more necessary when that wall is closer than ten feet behind your head. Originally, I got into room measuring mainly to show people how terrible typical rooms are. As I said earlier, most people have no idea how badly their room damages sound quality. They worry whether their loudspeakers are flat, while ignoring how much worse the response is made by their room. Of course, measuring is useful to assess the improvement after adding treatment, and to compare the benefit from different acoustic panel placements. It's also useful to see if more treatment is still needed, and at what frequencies the problems remain. What we measure The two main things we measure are raw frequency response as shown in Figure 1 above, modal ringing and reverb, and impulse response. Ringing is similar to reverb except it sustains some frequencies more than others. If you sing different notes in a large space like a church or auditorium, all of the notes will decay at more or less the same rate. In small rooms the decay times become much more frequency-dependant, especially at low frequencies. To view ringing decay time we use a "waterfall" graph like this:
In this type of graph the "mountains" come forward over time, and represent resonating peaks in the response. When some bass notes played in a room sustain longer than others, they will seem louder, and indistinct, creating the effect known as "one-note bass." The last type of graph shows the impulse response, which lets you see the timing and strength of individual reflections. We'll get to that later in this series, along with graphs that show reverb decay times versus frequency. In this introduction I explained the errors introduced by all untreated rooms. Once you know the audible problems a room causes, you then know what needs to be measured. And once you know what is being measured, you can better understand what the graphs displayed by room measuring software mean. Top |
| PART
2 - EQUIPMENT (NM) In this piece we will outline the hardware you will need. Bear in mind that there are many other options that would work just as well as the ones that I have recommended here. When you are considering other products, be sure to check if they have the basic functionality that is required. Beyond that you can't really go wrong! Shopping list of hardware needed:
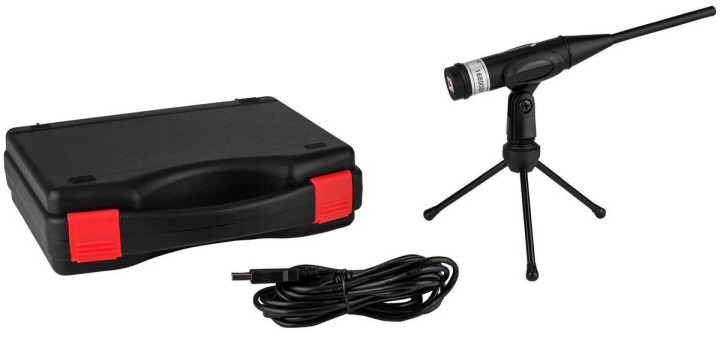
1) Measurement microphone You don't need to spend megabucks on a measurement microphone for room acoustics. At a minimum you should look for a microphone that has been measured to determine how that microphone sample varies from the target flat frequency response. A microphone that has been measured like this is called a calibrated microphone. The microphone will be supplied with a calibration file or sufficient information to allow you to create a calibration file. This file is used to compensate for the frequency response of the microphone in the measurement software. Unfortunately most cheap (but very suitable) microphones don't come with a calibration file, therefore you either need to spend more for one that does, or have your microphone calibrated. Note that a generic calibration files for a particular brand and model are normally not useful, since there are manufacturing vagaries which means each microphone sample will measure differently.
Recommended options:
2) Computer soundcard A computer soundcard for use in room acoustics measurement must be what is called full duplex - that is, it can play and record at the same time. For simple measurements you really only need one input and one output, although some of the measurement packages use the second channel in a two-channel soundcard to perform what is called a loop-back measurement. This can be used to further improve the accuracy of an acoustic measurement (more on this later). The other things that are required are a microphone level input and phantom power. Microphones output a very low voltage and so need a specialized high gain amplifier to bring them up to line level. This is typically provided by a dedicated "mic input," most of the time with XLR plug connection, although some soundcards use a TRS input. Most quality condenser microphones also require phantom power, which is typically 48 volts DC. Without this power the microphone will not work. Because of need for a preamp and phantom power supply, it is typical to use an external soundcard. Recommended options:
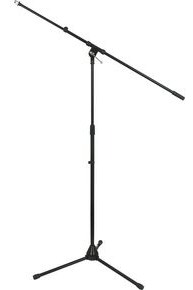
3) Microphone stand A stand is essential to place the microphone at the various locations typically used for room acoustics measurement (e.g. at ear location). At a minimum the stand should be stable, and adjustable in both the vertical and horizontal planes. Adjustability in the horizontal plane is provided by what is called a "boom" arm. Any generic stand should be fine; don't pay more than $30 or $40!
4) Cabling The cabling needed depends on which hardware you buy. If you follow my recommendations above you will need:
Connecting everything together
|
| PART
3- USING ROOM EQ WIZARD (EW) Over the years I've owned several popular room measuring programs, but these days I use mostly Room EQ Wizard. This program is offered as freeware, and it works beautifully with Windows. It claims to also work with Linux and Mac OSX 10.4 or higher, though I've never tested either of those. This article explains how to configure REW. In the next part Nyal Mellor will offer similar information about FuzzMeasure, a popular and highly capable program for Mac computers. As with most room measuring software, REW uses a sine wave sweep as its signal source. There are many advantages to using a sine wave sweep versus pink or white noise. The main advantage is a sweep offers a higher signal to noise ratio. When noise is used as the source it has to play for a longer time and be averaged. Indeed, one huge advantage of dedicated room testing software - versus an old fashioned Real Time Analyzer (RTA) with pink noise - is you can measure the room once, then display many different types of data and graphs later. An RTA can display only frequency response. When the software analyzes the sweep as recorded through your microphone, it can apply a tracking filter to the recorded tones. This is a sweepable filter that's applied internally by the software as it analyzes the recorded sweep. The filter passes only the frequency of interest at that moment, thus filtering out other sounds such as loudspeaker distortion, preamp hiss, your own breathing and footsteps, or outdoor traffic and barking dogs. A sine sweep also takes the software less time to do a measurement, especially at low frequencies. Room EQ Wizard doesn't use a tracking filter, though other room measuring programs do. REW instead lets you sweep multiple times to obtain a single measurement. Noise will be different for every sweep, where valid data is the same each time. Configuring REW The first step, after installing REW, is configuring it to work with your computer's sound card. Figure 4 shows the setup screen, accessed from the large Settings button near the top left of the main screen. I'll address only the choices needed to prepare REW for normal use. Anything not addressed in this article can be left at the default setting.
I generally use a sample rate of 44.1 KHz simply because that's what I use for recording music, though 48 KHz is fine too. Most computers have only one sound card, but some have internal and external cards, and some cards have multiple inputs and outputs. Figure 5 shows the drop-down box where you select which sound card to use.
As you can see, my studio computer has two physical
sound cards - a SoundBlaster X-Fi and a multi-port Delta 66 made by M-Audio. I use
channels 1 and 2 on the Delta 66 for REW, but I could just as easily use channels 3 and 4.
A similar drop-down selector lets you pick the input sound card, which could be different
than the output. Either the left or right channels can be used for the microphone input.
In this case I use the left channel. The output sweep tone is sent to both channels at the
same time, so there's no selection for that.
Using REW When measuring the low frequency response in a room, it's important to measure using both the left and right speakers sounding at once, plus the subwoofer. If you measure using only the subwoofer, data within an octave or so of the crossover frequency is not accurate. I'll have more to say about measuring with one versus all speakers playing in a moment. You can now close the Setup screen, and continue on to setting the output and input levels levels, and do a test sweep. Click the Measure button in the upper left of the main REW screen, and you'll see the Measurement screen shown in Figure 7 below.
In most cases you should set the lower and upper sweep range limits to 20 Hz and 20 KHz respectively. If your sub goes below 20 Hz you can use a lower frequency. If for some reason you feel the need to measure the response to higher than the 22,050 Hz limit of a 44.1 KHz sample rate, you can go back to the setup screen and select 48 KHz. Then you can measure up to 24 KHz. The only time I limit the sweep range is if I'm doing many measurements in a row and don't want to wait for the full sweep every time. So if you're using REW to help find the best location for a subwoofer, you could set the upper limit of the sweep to 200 Hz. Again, even if your sub crosses over at, say 100 Hz, it's still active to an octave or so higher, depending on the crossover slope (dB per octave). For some reason the Check Level button plays pink noise instead of a sine sweep, and the level is different than the sweep tone. So I just run a sweep to set levels, then cancel the measurement. The playback meter should read around -12, and you'll adjust your receiver's volume control so the sweep sounds fairly loud in the room. But not so loud it sounds like you'll damage your speakers, of course! Common sense applies here. The only reason you need to play the sweep fairly loud is to drown out all ambient noise in the room by at least 30 or 40 dB. Nulls 30 or more dB deep are common in most rooms, especially with little or no acoustic treatment. So if the ambient room noise is only 20 dB softer than the sweep at a null frequency, the true null depth will be hidden. Of course, the tracking filter built into REW mentioned earlier helps. Most room measurements are done with the microphone at the listening position, at ear height, and pointing straight up to not favor either speaker. It can be useful to measure at other locations, such as very close to the speaker to measure its own response at mid and high frequencies with less influence from the room. But for the most part, what matters is the response you hear at your usual listening seat. So place your microphone or SPL meter on a stand, with no obstructions on either side or above or below - including yourself! Next, click Start Measuring to display the play and record level meters (not shown), then adjust your microphone preamp's gain so the record meter averages around -20 or so, but peaking safely below 0. If the record level is too low, or too high, REW will tell you. If you don't get an error message, the levels are fine and you can do another sweep "for real" now. Earlier I mentioned playing the sweep tone through all speakers at once. With most pop music, and a lot of other music, and all LP records, the bass is centered left and right sounding equally through both speakers. So to know the true response at low frequencies for music you listen to, you should mimic that and play the sweep through both the left and right speakers too. If you use a subwoofer, that should also be engaged for the same reason. However, it's useful to also test each speaker separately. This will quickly reveal unusual problems such as a blown midrange driver, or a severe peak or null caused by a reflection on one side only. Using the RTA function Finally, I'll share a clever trick that can help you to place speakers, subwoofers, and even bass traps more efficiently. It takes REW only ten seconds to do a sweep and show the results, but it's still tedious to move a speaker or bass trap a few inches, measure, display, and repeat. Going back and forth constantly between handling the speaker and working your computer gets old very fast. And you have to keep deleting all the intermediate measurements. So to speed up the process I created a small (180 kb) Wave file that contains this Sweep Tone ranging from 20 to 400 Hz. Download this file to your computer, then set it to run continuously in Windows Media Player, or any other program that "plays nice" with Windows sound drivers and shares your sound card with other programs. Then switch to REW's Spectrum display (tab) as shown in Figure 8 to view the Real Time Analyzer (RTA).
Set all of the RTA parameters as shown in Figure 8 to get the highest resolution, then click the red Record button to enable the RTA display. Next, start the sweep playing in your media player program with the volume fairly loud in the room. Adjust the microphone preamp level until you can see the frequency response graph line on the screen. (You may also need to adjust the Graph Limits dB range to see the entire response line on the screen.) Now you can experiment with speaker placement, or microphone placement, or bass trap locations, and see the result of your changes immediately. Pretty cool! Top |
| PART
4 - FUZZMEASURE PRO 3 FOR MAC OSX (NM) For those of us with Apple Mac computers running OSX there are few choices for room measurement software. FuzzMeasure is one ($150); another is SMAART ($895), which is much more expensive and mainly targeted at the professional live sound reinforcement community. Note that FuzzMeasure requires OSX version 10.5 or higher. It will not work with 10.4. The rest of this article assumes that you have already installed / started up FuzzMeasure, installed the drivers for / plugged in your soundcard, and set up your measurement rig as per the instructions above. Configuring FuzzMeasure You will need to modify the Audio Capture Settings to get FuzzMeasure to work with your soundcard. These are accessible by clicking on the Capture Settings icon in the top bar in FuzzMeasure.
Next, set up FuzzMeasure so it averages a couple of sweeps, rather than relying on one measurement. This can be set through the top menu, under Measurement then Averaging.
Configuring your sound card The second thing you should do is set up any software volume controls that your soundcard has to ensure that the input and output levels are appropriate and that monitoring is disabled. In all cases you should set input volume level to maximum and monitoring to off. If you are connecting your soundcard to your system through an amplifer with a volume control, then you should set input volume to maximum. If you are connecting your computer directly to an amplifier that does not have a volume control (e.g. in my case I connect straight to a power amp as I do not have a pre-amp in my system) then you should set the output volumes very low.
Setting Levels I am assuming that you do not have access to a microphone calibrator to set absolute SPL levels. A microphone calibrator is a small device that fits over the end of the microphone and plays a 1 KHz sine wave at 94 dB. Most of us don't own a calibrator, so don't worry. When you are ready (with the volume turned down low on your amplifier!), set the input level dial on your soundcard to around the midway point. Now hit the Measure button in the top bar in FuzzMeasure. You will get a warning message, which you should read (!) and then press Play.
You should hear a sine sweep. Now turn up the volume so the sweep sounds fairly loud in the room. But not so loud it sounds like you'll damage your speakers, of course! Again, common sense applies. The only reason you need to play the sweep fairly loud is to drown out all ambient noise in the room by at least 30 or 40 dB. Once the measurement has completed (remember there will be three sweeps since we are using averaging), the frequency response will be displayed in the main window. A good way to check if the level is set right is to look at the highest point on the chart. It should be around -12dB or above. Getting the measurements Once you have a good measurement showing in the main window you can interpret it in many different ways.
Low resolution, full range frequency response |
 |
| High resolution, bass
range frequency response Set averaging to 1/24 octave under theFrequency > Smoothing in the top menu, and Frequency Range through the horizontal bar on the right side of the main measurement window to end at 300Hz. I turned off my EQ for these measurements, that's why they look ugly! |
 |
| Reverberation time You can access this using one of the plugins. Select under Plugins > Reverberation Time in the top menu.
Cumulative spectral decay
Envelope Time Curve |
 |
| PART
5 INTERPRETING THE GRAPHS (EW) In this final installment of the Room Measuring series I'll show the most important graph types displayed by room measuring software. For these examples I'll use a set of Before / After measurements taken in a typical "extra room" size space 16 by 11.5 by 8 feet, with and without extensive acoustic treatment. This is the same data I measured for the Hearing is Believing video on my company's web site. The software used is Room EQ Wizard. Frequency Response Everyone is familiar with frequency response graphs, as shown below in Figure 9.
In this graph the display is limited to the range below 400 Hz, since that's where bass traps have the most profound effect. Frequency response problems at mid and high frequencies are easy to tame with relatively thin absorbers. But bass problems are much more difficult to tackle. Graphs like this help you assess the improvement after adding bass traps and changing their position, and changing the placement of loudspeakers, including subwoofers, and even moving the listening seat. The speakers used for this test are flat to just below 40 Hz. Note that the graph above is at the highest resolution REW offers. REW also lets you apply averaging at various resolutions, such as 1/3 octave. But that is not appropriate at low frequencies because it hides the true extent of peaks and nulls. However, averaging is useful at mid and high frequencies. The response measured at higher frequencies is often riddled with peaks and deep nulls due to comb filtering. Comb filtering occurs in untreated rooms due to reflections from the side walls, floor, and ceiling. But comb filtering exists even in well treated rooms due to small differences in arrival time from the left and right speakers. If the measuring microphone is not precisely centered, equidistant to both speakers, that alone can cause a series of many peaks and deep nulls. This is shown in Figure 10 below.
After applying 1/3 octave averaging we get the graph in Figure 11 below, which is much easier to read and see the overall response without distraction.
Waterfall Plots Another very important graph type is called the waterfall plot. This is much more useful for assessing low frequency problems than seeing just the raw response because it also shows how some frequencies linger, taking longer to decay. This phenomenon is called modal ringing, and is caused by resonances within the room itself. The frequencies that peak and ring longer than others are related to the room's dimensions. The longer the dimension, the lower the frequency. In this type of graph the "mountains" come forward over time. I generally set waterfall plots in REW to show a 30 to 40 dB span vertically, with the Time Range set long enough to see decays over the first half second or so.
It's also important to set the Window time to at least 200 milliseconds to see enough frequency detail. This setting is in the lower right corner of REW's Waterfall tab shown at left. The Window time for waterfall plots is similar to the fractional octave (1/3, 1/12, etc) smoothing used for frequency response graphs. As you set the Window time longer, the Hz resolution becomes finer showing more detail. I generally use 300 milliseconds. The graph below in Figure 12 shows the room when empty, with no bass traps or other treatment.
After adding extensive bass trapping to the room, you can see in Figure 13 below that the response is much flatter and the decay times are also much more uniform. Extended decay times at some low frequencies, but not others, is just as damaging to audio quality as a skewed response. This ringing is the primary cause of the problem known as "one-note bass," where all notes played by the bass instrument seem to be at the same pitch even though they're not.
Reverb Time (RT60) The final graph type we'll consider is RT60, shown below in Figure 14. RT60 is acoustician shorthand for "Reverb Time to decay by 60 dB." Most people consider reverb as taking some amount of time to decay, which is true. But for room measuring it's useful to see the decay time at each individual frequency band. For example, a room that has too much thin absorption will decay quickly at high frequencies, while lower frequencies linger for much longer. This gives an unbalanced sound, similar to having a high frequency response roll-off. That is, if high frequencies don't linger as long as lower frequencies, the overall energy in the room is lower even though the absolute levels coming from the speaker are the same.
As you can see in the graph above, the decay times are much faster and much more uniform versus frequency after adding bass traps (and in this case diffusors) to the room. Envelope Time Curve (NM) The measurement below shows sound pressure level on the vertical axis and time on the horizontal axis. The graph is sometimes normalized so that the direct sound received from the loudspeaker is set to 0 decibels (dB) and 0 millisecond (ms). This chart, taken from FuzzMeasure, has not been normalized. From this graph you can see the level and time of reflections from room boundaries and other objects within the listening room. The target for this measurement is typically that the level of reflections should be at least 10 to 15 dB softer than the direct sound. Let's pretend there is a strong reflection at 10ms after the direct sound - the left-most peak at 8 ms on the chart below. To find where this is coming from in a room you will need to convert time into distance. The speed of sound is 1,125 feet per second (i.e. the sound from your speakers travels 1,125ft in one second). That equates to approximately 1.1 feet per thousandth of a second (i.e. 1.1 feet per ms). So in 10 ms the sound has traveled 11ft. You should then look around your room to identify the boundaries or objects that are causing the reflection. Remember that the sound has to travel to and from a boundary before it reaches the microphone position. Once you find the boundary in question then you can determine if that reflection is problematic and should be treated. Some reflections are not necessarily problematic (e.g. side walls away from reflection points), and there are different options on how to treat the reflection (it can be absorbed or diffused or reflected away). |
|
| 6
- ABOUT THE AUTHORS Ethan Winer is co-owner of RealTraps, and Nyal Mellor owns and operates Acoustic Frontiers. Top |
|
Entire contents
of this site Copyright © 2004- by RealTraps, LLC. All rights reserved. |